Welcome back to the Hoop Vision newsletter!
Like everyone else in college hoops, we’ve spent the past couple weeks getting some much-needed rest and relaxation, all while keeping our eyes on transfer announcements, NBA Draft decisions, and stunning retirements (wishing you well, Jay Wright!).
A couple weeks removed from a deeply entertaining NCAA Tournament and an equally memorable Final Four, we’re diving into one of the most intriguing — and most discussed — aspects of this year’s final four teams.
The year of the starters
The final weekend of the 2022 college basketball season was all about the Blue Bloods.
We all know what happened that final weekend in New Orleans: North Carolina and Duke faced off for the first time ever in the NCAA Tournament. Two nights later, Kansas knocked off the Tar Heels, as Bill Self claimed his second national championship.
Putting aside blood colors, the Final Four teams all shared a curious characteristic: a stunning lack of reliance on bench minutes.
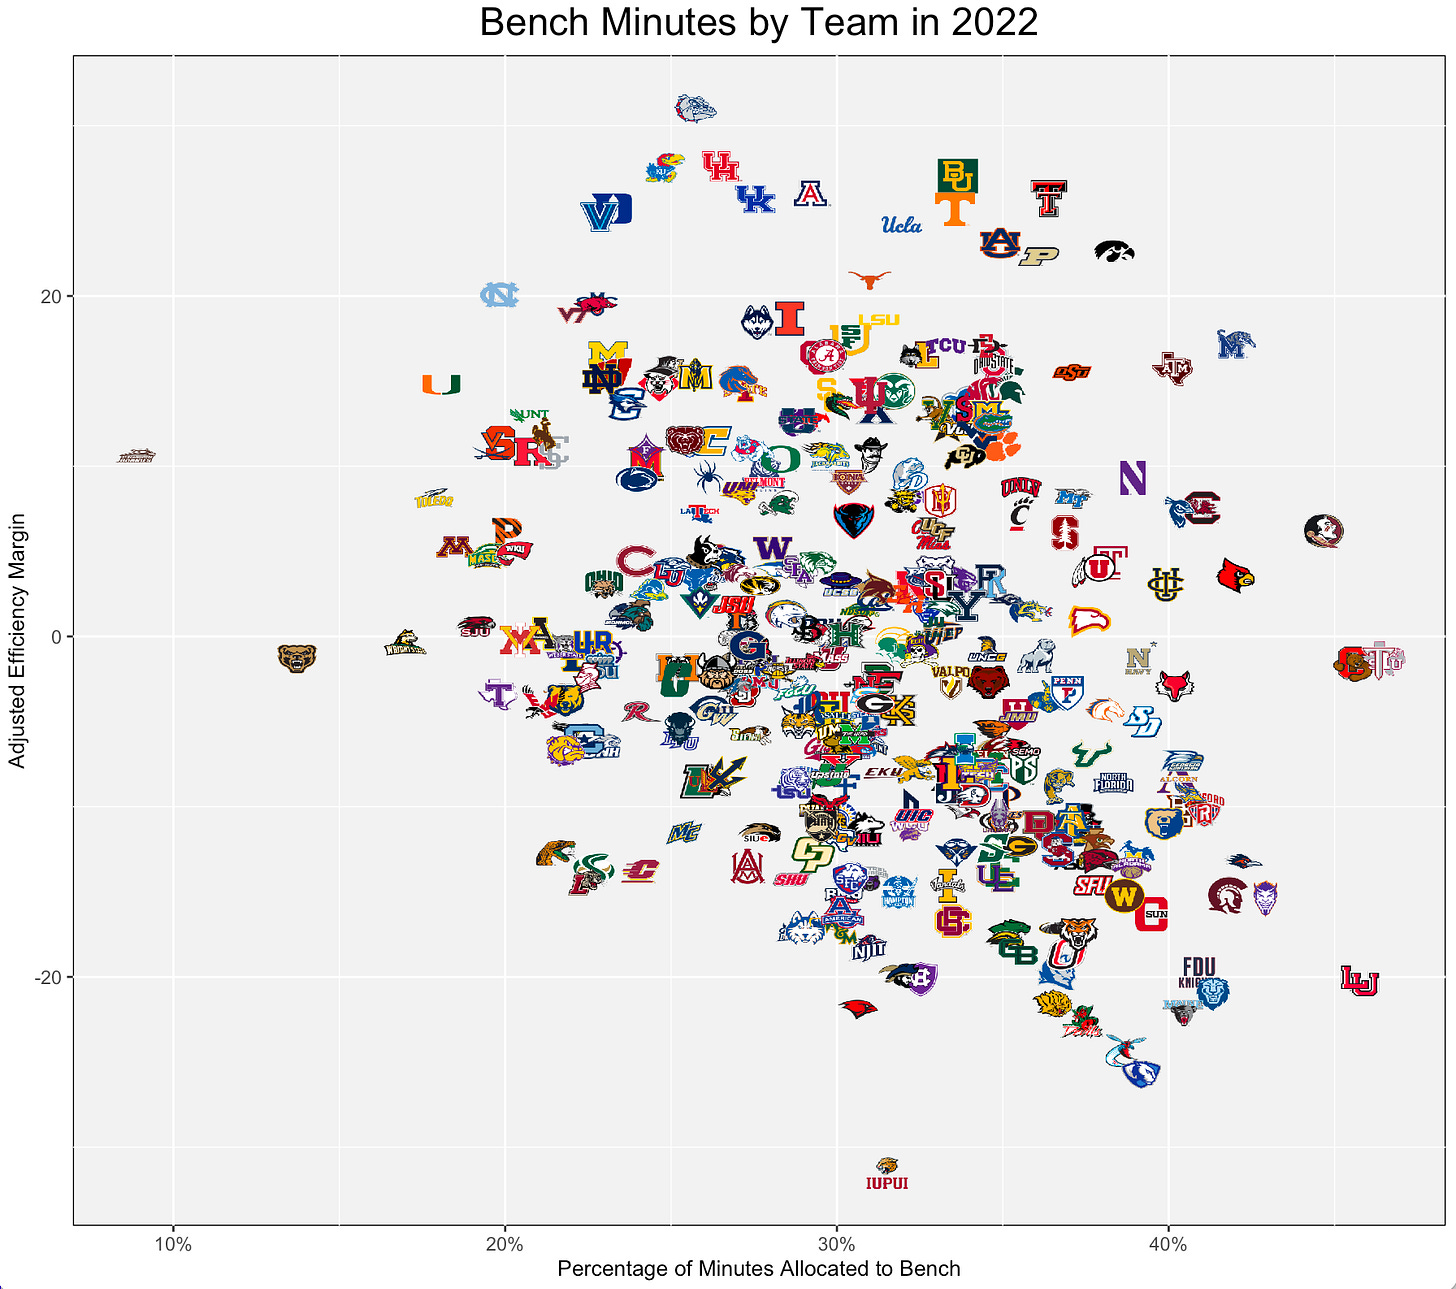
If we think about the top teams in the country this season, 16 teams finished the season with a kenpom adjusted efficiency margin better than 20 points.
Of those 16 teams, the four with the fewest bench minutes were the final four teams left playing in New Orleans.
Each of the four national semifinalists ranked near the bottom of the entire country in bench minutes. The breakdown:
UNC — 348th (out of 358)
Villanova — 320th
Duke — 314th
Kansas — 301st
Yes, it’s extreme — but not necessarily unprecedented.
Good teams use their bench less
The graph from the first section contained only teams from the 2022 season, but we can expand our data — via kenpom.com — to stretch back another 10 plus years.
Below, you will find a graph representing every single Division I team since the 2010 season. The x-axis is bench minutes. The y-axis is kenpom adjusted efficiency margin (team strength).
On average, stronger teams played their bench less frequently than weaker teams.
The breakdown — over the past 10 plus seasons….
329 teams finished the season with an adjusted efficiency margin above 20 points. They allocated 28.8% of available minutes to their bench.
204 teams finished the season with an adjusted efficiency margin below -20 points. They allocated 34.5% of available minutes to their bench.
Bench usage decreases later in season
Of course, bench minutes are not necessarily static throughout the season.
In November and December, teams generally use reserves most often. Injuries and mid-season transfers can play a role in the later months, but the leading factor for this pattern is likely just natural role allocation over the course of a season.
Instinctively, it makes sense: unproven players are given a chance to contribute early in the season. As the season progresses, the plug gets pulled on certain players, and coaches ride with their reliable — often veteran — standout players.
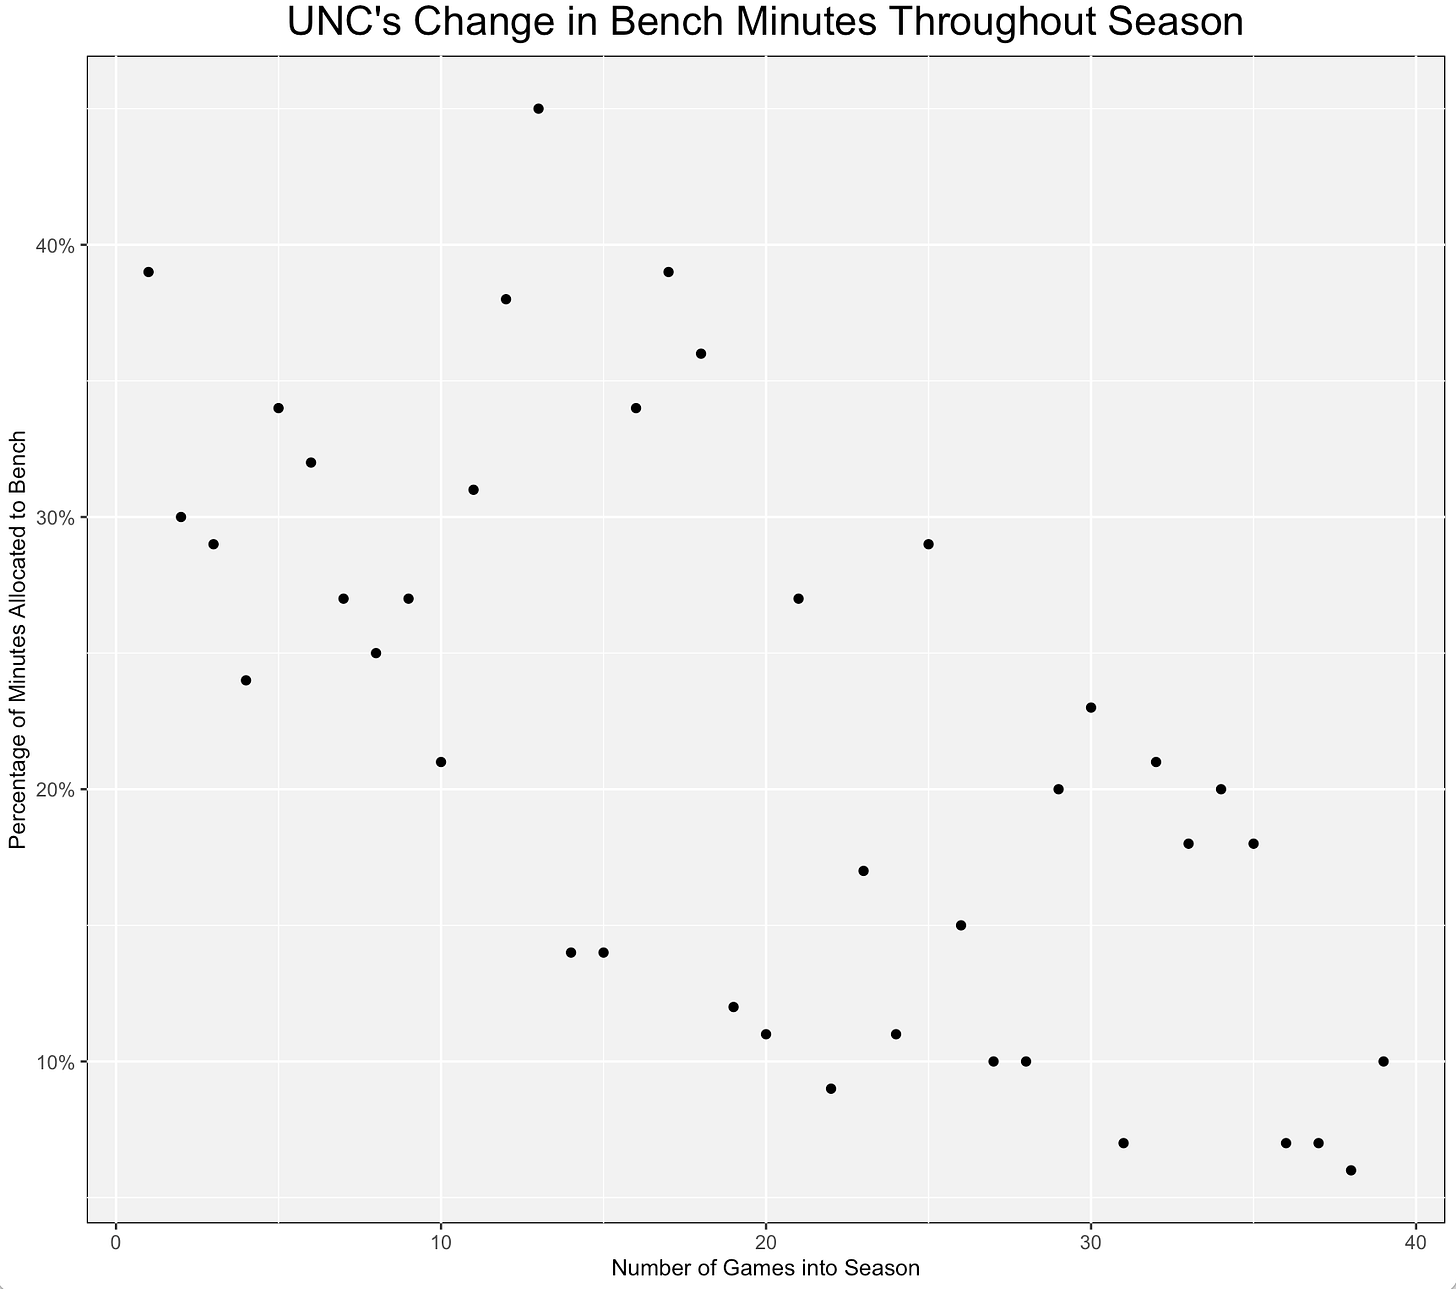
This year’s North Carolina team is a good example of that. The graph below shows a game-by-game look at the Tar Heels’ bench minutes.
In ALL of UNC’s final 14 games, the reserves never played more than 25% of available minutes.
In the team’s first 14 games, reserves played over 25% of available minutes in all but three games.
There’s another factor involved here that plays a significant role on substitution patterns: The score of the game.
In blowouts, the bench gets emptied. In close games, starters are relied upon for more prominent roles and more significant contributions.
In North Carolina’s case, we can look at the effect of the score by making a slight change to our graph.
This time, the size of each point represents the scoring margin of the game. The bigger the point, the bigger the blowout.
In games decided by single digits, UNC reserves played 14% of minutes
In games decided by double digits, UNC reserves played 25% of minutes
Clearly, the score of the game affected North Carolina’s substitution patterns. But it doesn’t explain the entire effect. Even when controlling for score, Hubert Davis still relied on his bench far more in the early part of the season.
Correlation does not imply causation
It’s tempting to look at the graphs and data above and jump to conclusions.
A person who rushed to judgment after reading the above sections might be saying something like….
“Play your bench less!”
“Lean heavily on your starting five! All (or many) of the best teams do it!”
“Depth doesn’t matter in March!”
However, it’s important to remember that correlation does not imply causation.
The above data is not proof that playing fewer players causes team success — in fact, I think the opposite is likely a bit more accurate.
There are several different reasons why a coach might make a substitution, but the most obvious one is performance-based. The score isn’t moving in the right direction, so the coach makes a change in the personnel on the court.
In other words, the fact that the team is losing is what causes the substitution — not the other way around.
Alternatively, a team that dominates a game from wire-to-wire simply has less incentive to go to the bench. The players on the floor are already working well together.
So when trying to duplicate the success of this year’s Final Four teams, I don’t think the takeaway is to just use your bench less. I think the real takeaway is to — (checks notes) — have really good starters?
It’s a very obvious takeaway, but a team’s starting five separating itself from the rest of the pack is inherently good for business, particularly in close games.
You saw it last month: that is what happened with North Carolina.
That’s what happened with Kansas (with the exception of Remy Martin).
And that’s what happens with a lot of good teams.
Thank you for supporting Hoop Vision for another season. Your attention, curiosity, and support never go unappreciated.


