


Scorekeeper Bias & Synergy (HV Weekly: 8/31/2020)
This one's for the stat nerds.
We are BACK (a day late) with another edition of the Hoop Vision Weekly.
This week’s edition covers a fairly esoteric topic, but one which touches every single college basketball program or professional team, as they try to accurately assess — and make decisions from — the data they collect.
Before we fully dive into the specifics on shot type and data interpretation, a quick look back on what Hoop Vision PLUS subscribers were sent this past week….
Weak Hand Theory (HV+)
After spending a good two weeks immersed in Carleton’s weak hand defense, I wanted to see how Dave Smart’s theory might translate to other defensive schemes. So last week, we charted every single three-pointer that Baylor and Texas Tech allowed last season to learn more about weak hand passing.
The Hoop Vision PLUS breakdown includes both quantitative and qualitative observations from that charting process — like whether opponents had more success going to their strong hand against the two no-middle defenses.
Want the full Hoop Vision experience? Subscribe to HV+ for tutorials and exclusive content— all while supporting independent, ad-free college basketball coverage.
Scorekeeper Bias
The process of generating data — particularly when done manually by a human — is often more of an art than a science.
For college basketball play-by-play data, the scorekeeper is given four options to categorize each shot attempt:
Dunks
Layups
Two-Point Jumpers
Three-Pointers
(Note: Dunks and layups are often combined into “shots at the rim” — and will be for our research as well.)
These categories simply aren’t specific enough to accurately describe every shot attempt. As a result, there are inconsistencies across different scorekeepers.
Back in 2014, Kevin Whitaker examined this topic in a great article: How scorekeeper biases affect shot-selection data.
The research provided some preliminary evidence for the inconsistencies in shot type definitions from scorekeeper to scorekeeper. In other words, a team could take the exact same shots in two different games, but wind up with varying shot data depending on the scorekeeper. As Kevin put it:
Where there is subjectivity, there is the possibility of bias. Not “bias” in the pejorative sense that indicates a nefarious motive, but “bias” in the statistical sense — scorekeepers at different arenas might have more (or less) inclusive definitions of the term “layup,” leading them to count more (or fewer) shots in that category.
Synergy Sports Shot Data
For a long time, I’ve wanted to build off of Kevin’s work by using Synergy data.
In coaching circles, the data generated from Synergy’s logging is often maligned (just ask Jim Boeheim). And to be fair, there are plenty of limitations in different aspect’s of Synergy data.
However, Synergy shot data is likely the most accurate source we have readily available. First off, the logging is done with the luxury of video replay — not in real-time like the play-by-play scorekeepers. Second, the categories are more specific than the four we saw in the previous section. Shots are broken up into six categories:
Around basket
Runners
Post-ups
Short jumpers
Medium jumpers
Three-point jumpers
There is still a degree of subjectivity in Synergy’s classifications, but the more specific categories are a giant step in the right direction. The shots being classified by Synergy as “runners” and “post-ups” are likely some of the exact shot attempts the official PBP scorekeepers struggle with most.
Comparing Play-by-Play to Synergy
Comparing the two different data sources can help give us a better understanding of the existing biases.
Unfortunately, this isn’t a true apples-to-apples comparison. Synergy’s aggregated shot data only include shots taken during half-court possessions — transition plays are excluded. On the other hand, aggregated play-by-play data (taken via BartTorvik.com) includes all shots.
Regardless, we can compare three-point volume (percentage of shots that are threes) by team from the two data sources to establish a baseline. In theory, a team’s three-point volume should be identical regardless of data source. It’s the shot type with the most objective definition.

As you can see, Synergy and PBP are very neatly correlated for three-point volume. Even with Synergy’s removal of transition plays, there are no major outliers.
Now we can compare three-pointers to a much more subjective shot type — shots at the rim. Unlike threes, determining whether or not a shot was at the rim requires some amount of scorekeeper judgment.

As expected, the subjectivity involved in categorizing shots at the rim leads to a weaker correlation between the two data sources.
Two of the bigger outliers:
Stephen F. Austin ranked #1 in volume of shots at the rim according to PBP. According to Synergy, they ranked #52
Duke ranked #8 by PBP and #151 by Synergy
It just so happens Stephen F. Austin and Duke played a fairly memorable game last season, so I chose to use that game to investigate the differences between the two data sources even further.
Comparing an Individual Game
The following table compares how each shot attempt (combining both teams) was charted by Synergy and PBP in Stephen F. Austin’s upset win at Duke.
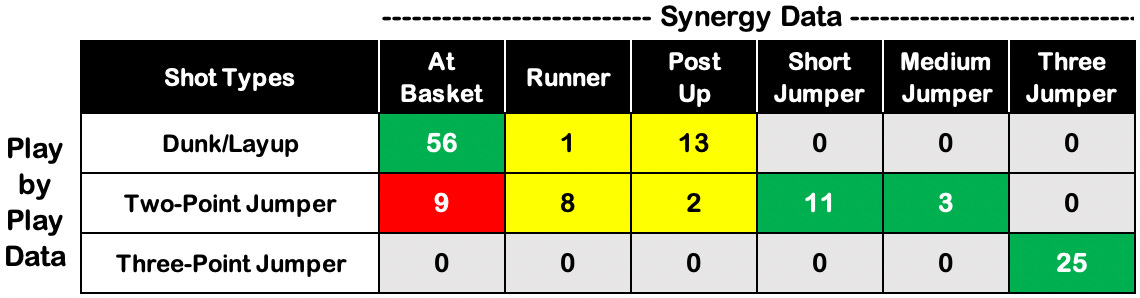
As we would expect, all 25 three-point attempts from the game were correctly classified by Synergy and PBP. No inconsistencies there.
In total, Synergy classified 14 shot attempts as either short or medium jumpers. All 14 of those attempts were also classified by the play-by-play as two-point jumpers. No inconsistencies there either.
The two columns in yellow are the most subjective. Runners and post-ups — as classified by Synergy — don’t inherently fall into one of the three standard PBP categories. They are open for interpretation by the scorekeeper.
In this memorable game (a buzzer-beating win for Stephen F. Austin, if you somehow missed it), 13 of 15 post-ups were classified as shots at the rim, while the other two were classified as two-point jumpers. Upon rewatching the game, both teams were regularly fronting post. As a result, many of the post touches were on lobs over the top, and not the back-to-the-basket hook shot variety of post-ups you may be imagining. I’d suspect a game with more traditional post touches might produce different results — with a larger percentage of post-ups being classified as two-point jumpers.
If you look back at the table above, the most concerning (or inconsistent) part of that table is highlighted in red. Of the 65 shots classified by Synergy as “at basket,” nine of them were deemed two-point jumpers by the official scorekeeper.
After watching the film, eight out of the nine shots were (in my opinion) very clearly not jump shots. In other words, Synergy was much more likely to be accurate.
Here’s one of the more egregious misses from the play-by-play data. This drive to the hoop by John Comeaux was classified as a two-point jumper.

Here’s another example of a play that was also classified inconsistently — again by Synergy as at the basket and by PBP as a two-point jumper.
The clip is an example of some of the tougher instances to decipher. It’s pretty clearly not a jump shot, but the defense also prevents SFA guard Cameron Johnson from getting to the rim.
Based on previous experience charting plays, I think that the result of a play can (sometimes subconsciously) influence the classification. My guess is that if Johnson’s shot doesn’t get blocked, it gets classified as an at the rim layup.
The Moral of the Story
On a micro-level, I’d still recommend using Synergy over PBP when possible. That doesn’t mean Synergy doesn’t come with it’s own set of limitations (especially on the defensive side of things), but it has several essential advantages over PBP.
The much larger takeaway here is the importance of investing time and energy into fully understanding the data being used and the process in which that data is generated.
It’s one thing to have small one-off mistakes in a data source — like a random entry error. It’s another thing to have systemic issues or biases.