Off-Ball Screens and Three-Pointers
Virginia's Blocker-Mover offense isn't generating a lot of threes. Is that bad?
Welcome back to another edition of The Starting Five. To read last week’s version, you can click/tap here.
Back in 2019, I wrote a newsletter called “Visualizing Offensive Scheme”. The idea was to split teams into three major categories:
Princeton-style teams (high volume of cuts)
Motion-style teams (high volume of off-ball screens)
“Space-only” teams (low volume of cuts and off-ball screens)
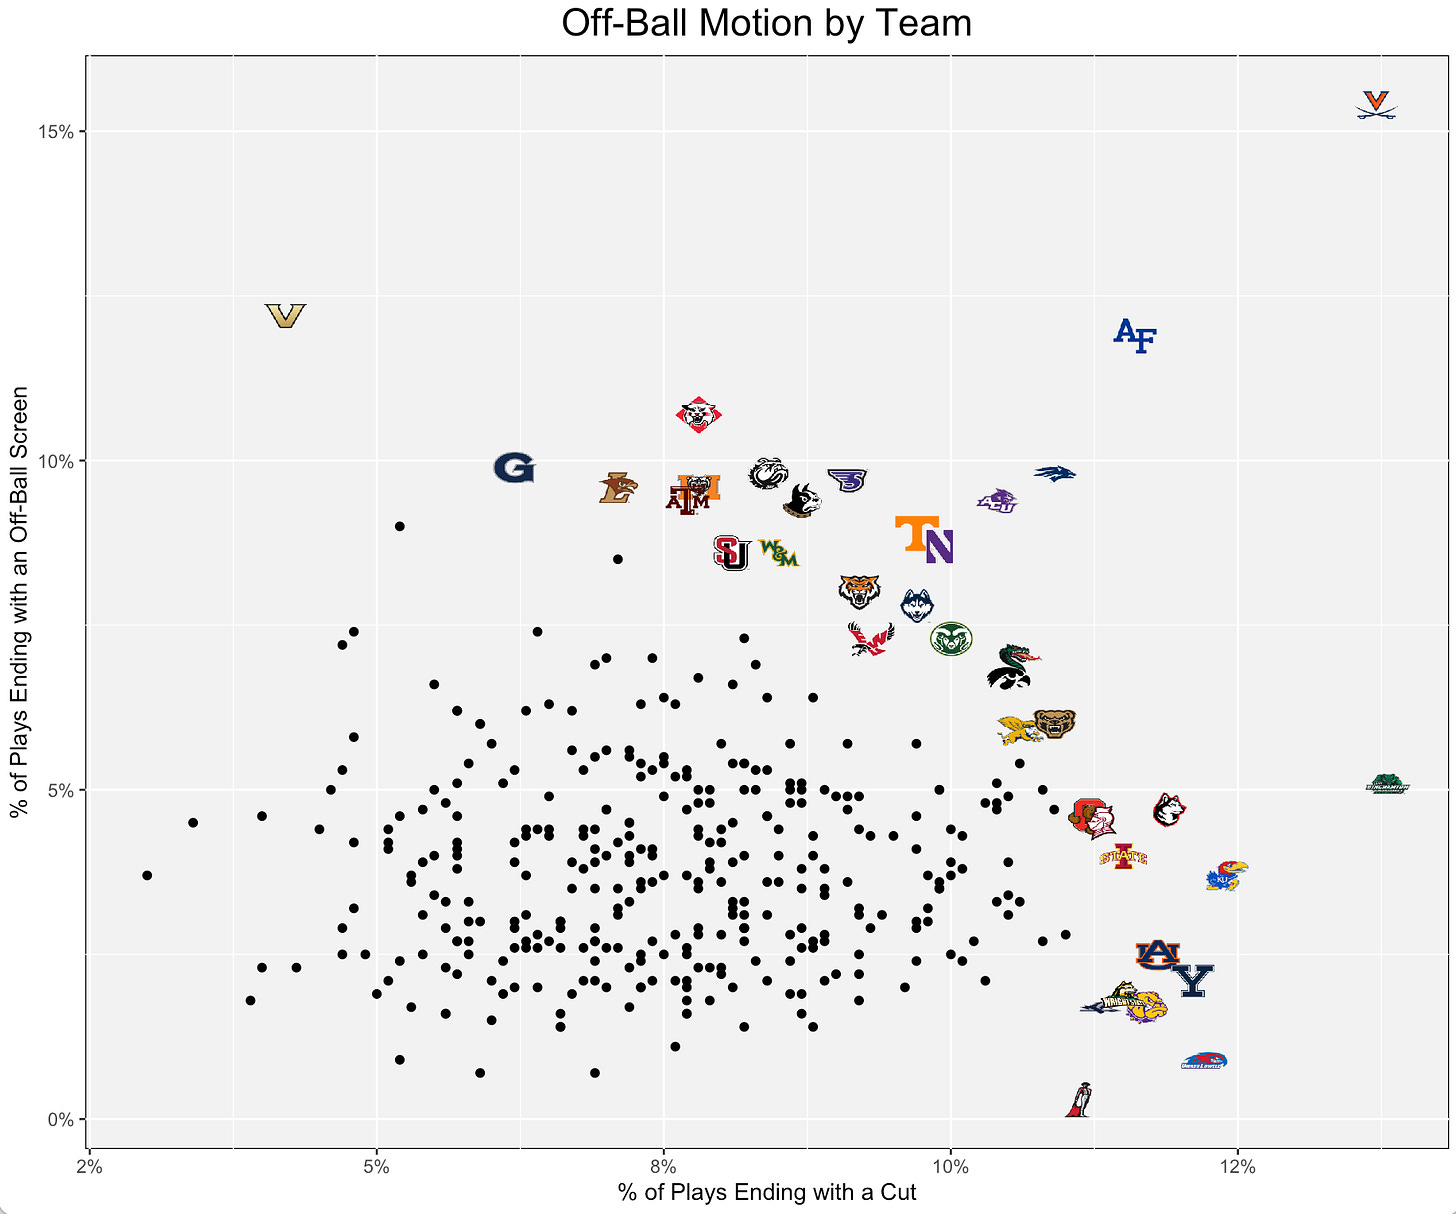
The newsletter featured a graph which plotted cut volume on one axis and off-ball screen volume on the other axis.
Looking back on that piece, I think that visualizing (or quantifying) offensive scheme is a little more complicated than just looking at screen and cut data.
So while I’d argue that the newsletter/graph didn’t do a great job of delivering on its title, it’s still not completely worthless. The graph at least did a reasonable job of finding offensive outliers.
For instance, let’s look at this season’s version of the graph.
As you can see, Virginia’s offense is a big outlier this season. They use the most off-ball screens of any team in the country and the second most cuts. (When I first started researching this piece, they were actually ahead of Binghamton in cuts. Binghamton just barely overtook them over the weekend.)
Virginia’s offense is especially interesting, because — even though they set a lot of screens for shooters within their Blocker-Mover offense — they don’t create a lot of three-point looks.
Tony Bennett’s squad has generated 182 shots via off-ball screens this season (per Synergy Sports). Of those 182 shots, 69 have been three-point attempts (38%).
So that begs the following questions…
How does that 38% three-point rate compare to other motion-based teams?
Has the Blocker-Mover always generated a high volume of twos in past seasons?
Is the Blocker-Mover setting Virginia up for offensive failure?
Let’s try to answer those and more in today’s newsletter.

