Welcome to another edition of the Hoop Vision Weekly!
There are a lot of new faces in the crowd this week, as last week’s newsletter on “copycat coaching” was our most-shared edition yet. A huge thanks to everyone spreading the word.
And to the new readers — welcome aboard! Wonderful to have you.
In today’s edition:
The most “zonable” teams of the decade
A review of the most pertinent findings and discussion points from the summer
As always, your continued support and sharing of this newsletter is appreciated. Lots of exciting stuff in the works, and a few big announcements coming this month.
Who gets zoned the most?
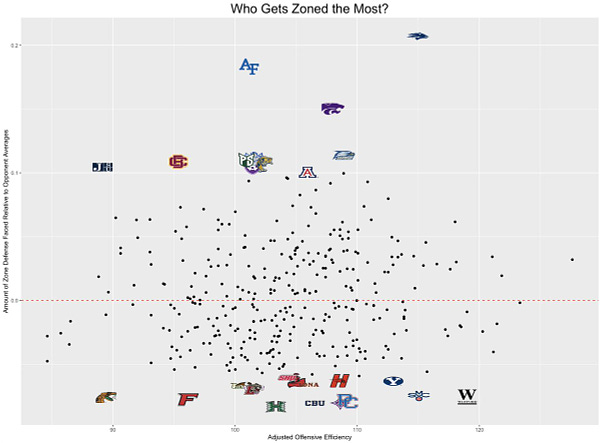
Back in March, we briefly tweeted about the idea of “zonability.”
At the time, Nevada had faced zone on 36% of their offensive plays. Based solely on their opponent’s defensive averages (norms), we would have only expected the Wolf Pack to face zone on 16% of plays.


Regardless of the opponent, we know a defense like Syracuse is going zone, basically no matter what. But we begin to learn something by looking at the games in which a defense deviated from their normal defensive scheme; in most cases, this deviation stems from a perceived strength or weakness of an opponent.
Last season, Nevada and Air Force were the two teams which opponents deemed most optimal to play zone against.
Nevada was one of the taller teams in the country from top to bottom, with no starter under 6-foot-7 — a starting lineup which also featured some very good scorers in isolation situations.
On the other hand, Air Force runs the Princeton offense — traditionally a headache for opponents to gameplan against — and shot just 32.4% from three last season. A team running the Princeton offense that doesn’t shoot the ball particularly well? They’re practically begging for zone.
There’s an interesting contrast between the two teams in terms of overall offensive efficiency. Nevada finished 26th in the country in AdjO, Air Force just 252nd.
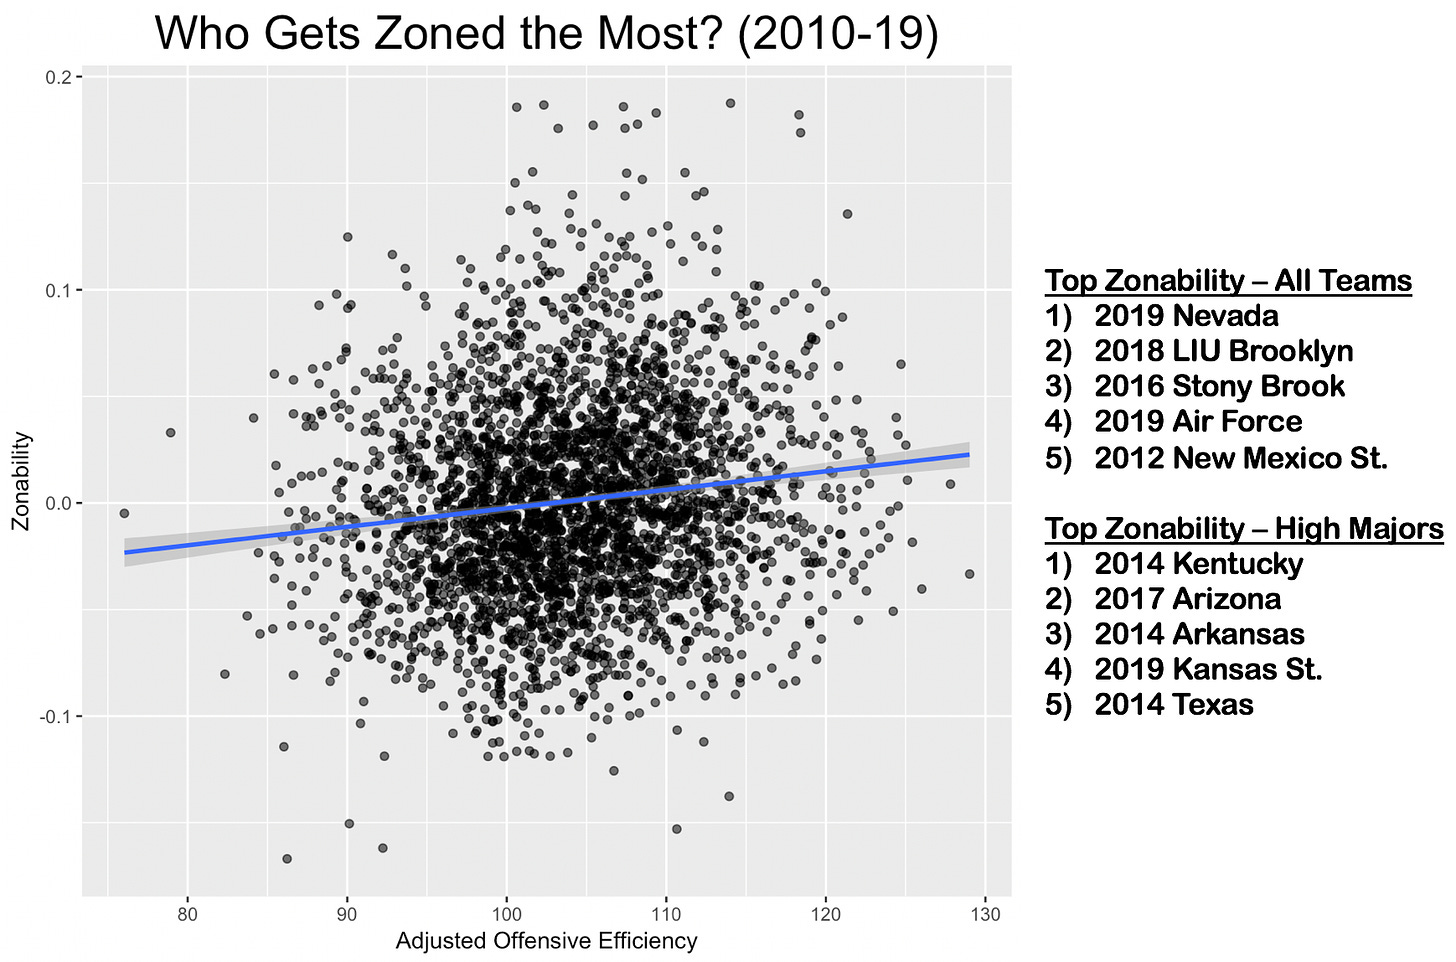
So what types of teams have the most “zonability”? We expanded the sample size back to 2010 and produced a similar graph to the tweet from March.

There is a correlation between offensive efficiency and zonability, but it’s miniscule.
In other words, a good offense is slightly more likely to get zoned than a bad offense, but it’s generally not a good predictor.
Nevada and Air Force both show up on the list of top zonability of the past decade. Other teams on the list make intuitive sense:
2014 Kentucky has some similarities to 2019 Nevada. They had lots of size, with no one in the starting lineup under 6-foot-6. That Wildcats squad — just like Nevada — also had twins in the backcourt in Andrew and Aaron Harrison.
2017 Arizona ranked 5th in the country in average height. Lauri Markkanen was actually the best shooter on a squad that didn’t have much shooting in the backcourt.
2014 Texas ranked 330th in three-point volume and 245th in three-point percentage.
2016 Stony Brook had three-time America East Player of the Year Jameel Warney banging in the paint.
So for most of these teams, a narrative can be applied to provide some insight into the thought process of opposing coaches before deciding to zone.
But what does a more data-oriented approach tell us about zonability? We looked at a variety of different variables to build a regression model to predict zonability at a stronger rate than simply offensive efficiency.
Remember, AdjO had a very weak correlation to zonability. The r-value was just 0.13. By opening it up to other variables, the regression model increased the r-value to 0.44.
The most predictive variables (from strongest to weakest) of zonability in that model were as follows:
Three-point efficiency. Easy, simple, good ole’ 3P% was the most predictive of zonability. Teams that shoot the ball poorly from deep are most likely to be zoned.
Adjusted offensive efficiency. Like most exercises, this is what we started with to begin the analysis— and AdjO ranked second behind 3P%.
Three-point volume. Teams that shoot fewer threes are more likely to be zoned, but volume was not as predictive as efficiency.
Defensive turnover rate. This is the first variable that might be unexpected. Teams that turn their opponents over at a high rate were more likely to be zoned. It seems likely that TO% is acting as proxy for overall athleticism. Dribble drive ability, which would be tricky to quantify, might be a more direct way to measure athleticism for this purpose.
Height. Despite the fact that there seemed to be some anecdotal evidence in support of height with Nevada, Kentucky, and Arizona — it ranked just fifth. It did, interestingly, perform slightly better than two-point percentage.
The most zonable teams, to no surprise, tend to be some combination of tall, athletic, and efficient with a weakness for three-point shooting. But even so, there is a high degree of variation not explained by the model.
As for the most zoned programs throughout the entire decade? That list would include Arizona, Air Force, Nevada, UConn, and South Florida.
*Of note, Arizona is the only program on that list with the same coach throughout the entire decade.
A summer in review
As the NCAA Tournament ended, the Hoop Vision braintrust made a conscious decision to keep this thing going on a weekly cadence; I’m glad we did, and we tried to bring the heat all summer long, particularly as other outlets scaled back on production.
In case you’re new around these parts or just happened to miss a week while on the road recruiting — or taking a much-deserved vacation — here’s a recap of the insights reached along the way over the past couple months:
Visualizing Offensive Scheme (6/23/19)
We introduced a graph attempting to visualize offense scheme. Three general groups were highlighted:
Princeton-style offense (Holy Cross, Air Force, Richmond)
Motion-style offense (Virginia, Kennesaw State, Wofford)
Space-only offense (Saint Mary’s, Villanova, and a team not mentioned that led into the following week’s newsletter)
We Are Marshall (6/30/19)
We went a step beyond simply categorizing offensive schemes to look at effectiveness. Including this graph on the correlation between motion and efficiency/pace.
We then jumped into Dan D’Antoni’s epic analytics rant and the pace-and-space philosophy in general. While Marshall has finished in the top 50 of eFG% three times under D’Antoni, the philosophy has a somewhat incomplete goal:
“The goal isn’t just to maximize effective field goal percentage, it’s to maximize net efficiency. At the college level, it’s not an easy task to find players well-suited for pace-and-space while not compromising defense and rebounding.”
Ball Screen Essentials (7/7/19)
Next we took a deep dive into ball screen theory. 250 of 353 (71%) teams were more efficient in passing situations out off ball screens compared to when the handler shoots.
Even with that in mind, ball screen defense is still a complicated issue:
“While it is fairly safe to say that defenses should want to keep the ball in the handlers hand and force him to shoot in ball screen situations, it’s also oversimplifying. This isn’t a binary decision making process like deciding to run or pass in football or deciding to bunt or hit in baseball.”
Instead of picking a discrete option, the defense picks a coverage. So we then looked at two extreme examples of ball screen coverages:
Siena and Jalen Pickett. The most blitzed team in the country.
The game we played ball screens 2 on 2 against Saint Mary’s (video)
Quantifying Defensive Scheme (7/14/19)
We gave defense the same treatment as offense in this one. First, we took a look at which types of defenses force the most isolation:
“The moral of the story here is that, regardless of scheme, elite defenses still tend to force isolations. The switching and denying (especially at the extremes) can help add to our ability to predict isolations, but the strongest variable in that prediction is overall defensive strength.”
The top defenses at forcing isolations last season (Nevada, Gonzaga, Duke, Illinois, and Texas Tech) were featured in this video.
Then we differentiated between gap and denial defenses. With graphs indicating:
“Gap defenses (low turnover rates) increase the frequency of post-ups and off-ball screen action - both of which tend to require entries to the wing.
Denial defenses (high turnover rates) increase the frequency of isolations and off-ball basket cuts.”
Defending the Three (7/21/19)
Three-point defense took center stage the following week with a simple question: Three-point attempts are controllable, but should you want to control it?
We found that there are plenty of different pathways to an elite defense. We then focused heavily on Virginia Tech, a team that didn’t prioritize three-point defense in the slightest, but still finished 20th in efficiency.
Virginia Tech held opponents to 0.55 points per isolation play on the season - #1 in the country.
RJ Barrett (11), Chris Lykes (9), Carsen Edwards (7) all had their season high in assists against Virginia Tech. Ty Jerome (12) had his second-highest season total.
Film on Virginia Tech one pass away steals
Individual Defense (7/28/19)
The struggles of quantifying an individual player’s defense was the topic in this week’s edition. We discussed the tension between statistical modeling and coaching, thanks to the modeling use of proxy variables and the coaching need for the “why”.
Next was a defensive accounting report we used at NMSU which is essentially an attempt at a “numerical eye test”.
Then we went futuristic and discussed how AI and machine learning, once trained to watch a basketball game like a coach, will probably be able to have a better eye test than any human.
To close out the summer, we took deep dives into Bill Self’s offense and Brad Stevens’ defense.


